CropScanAg on social media

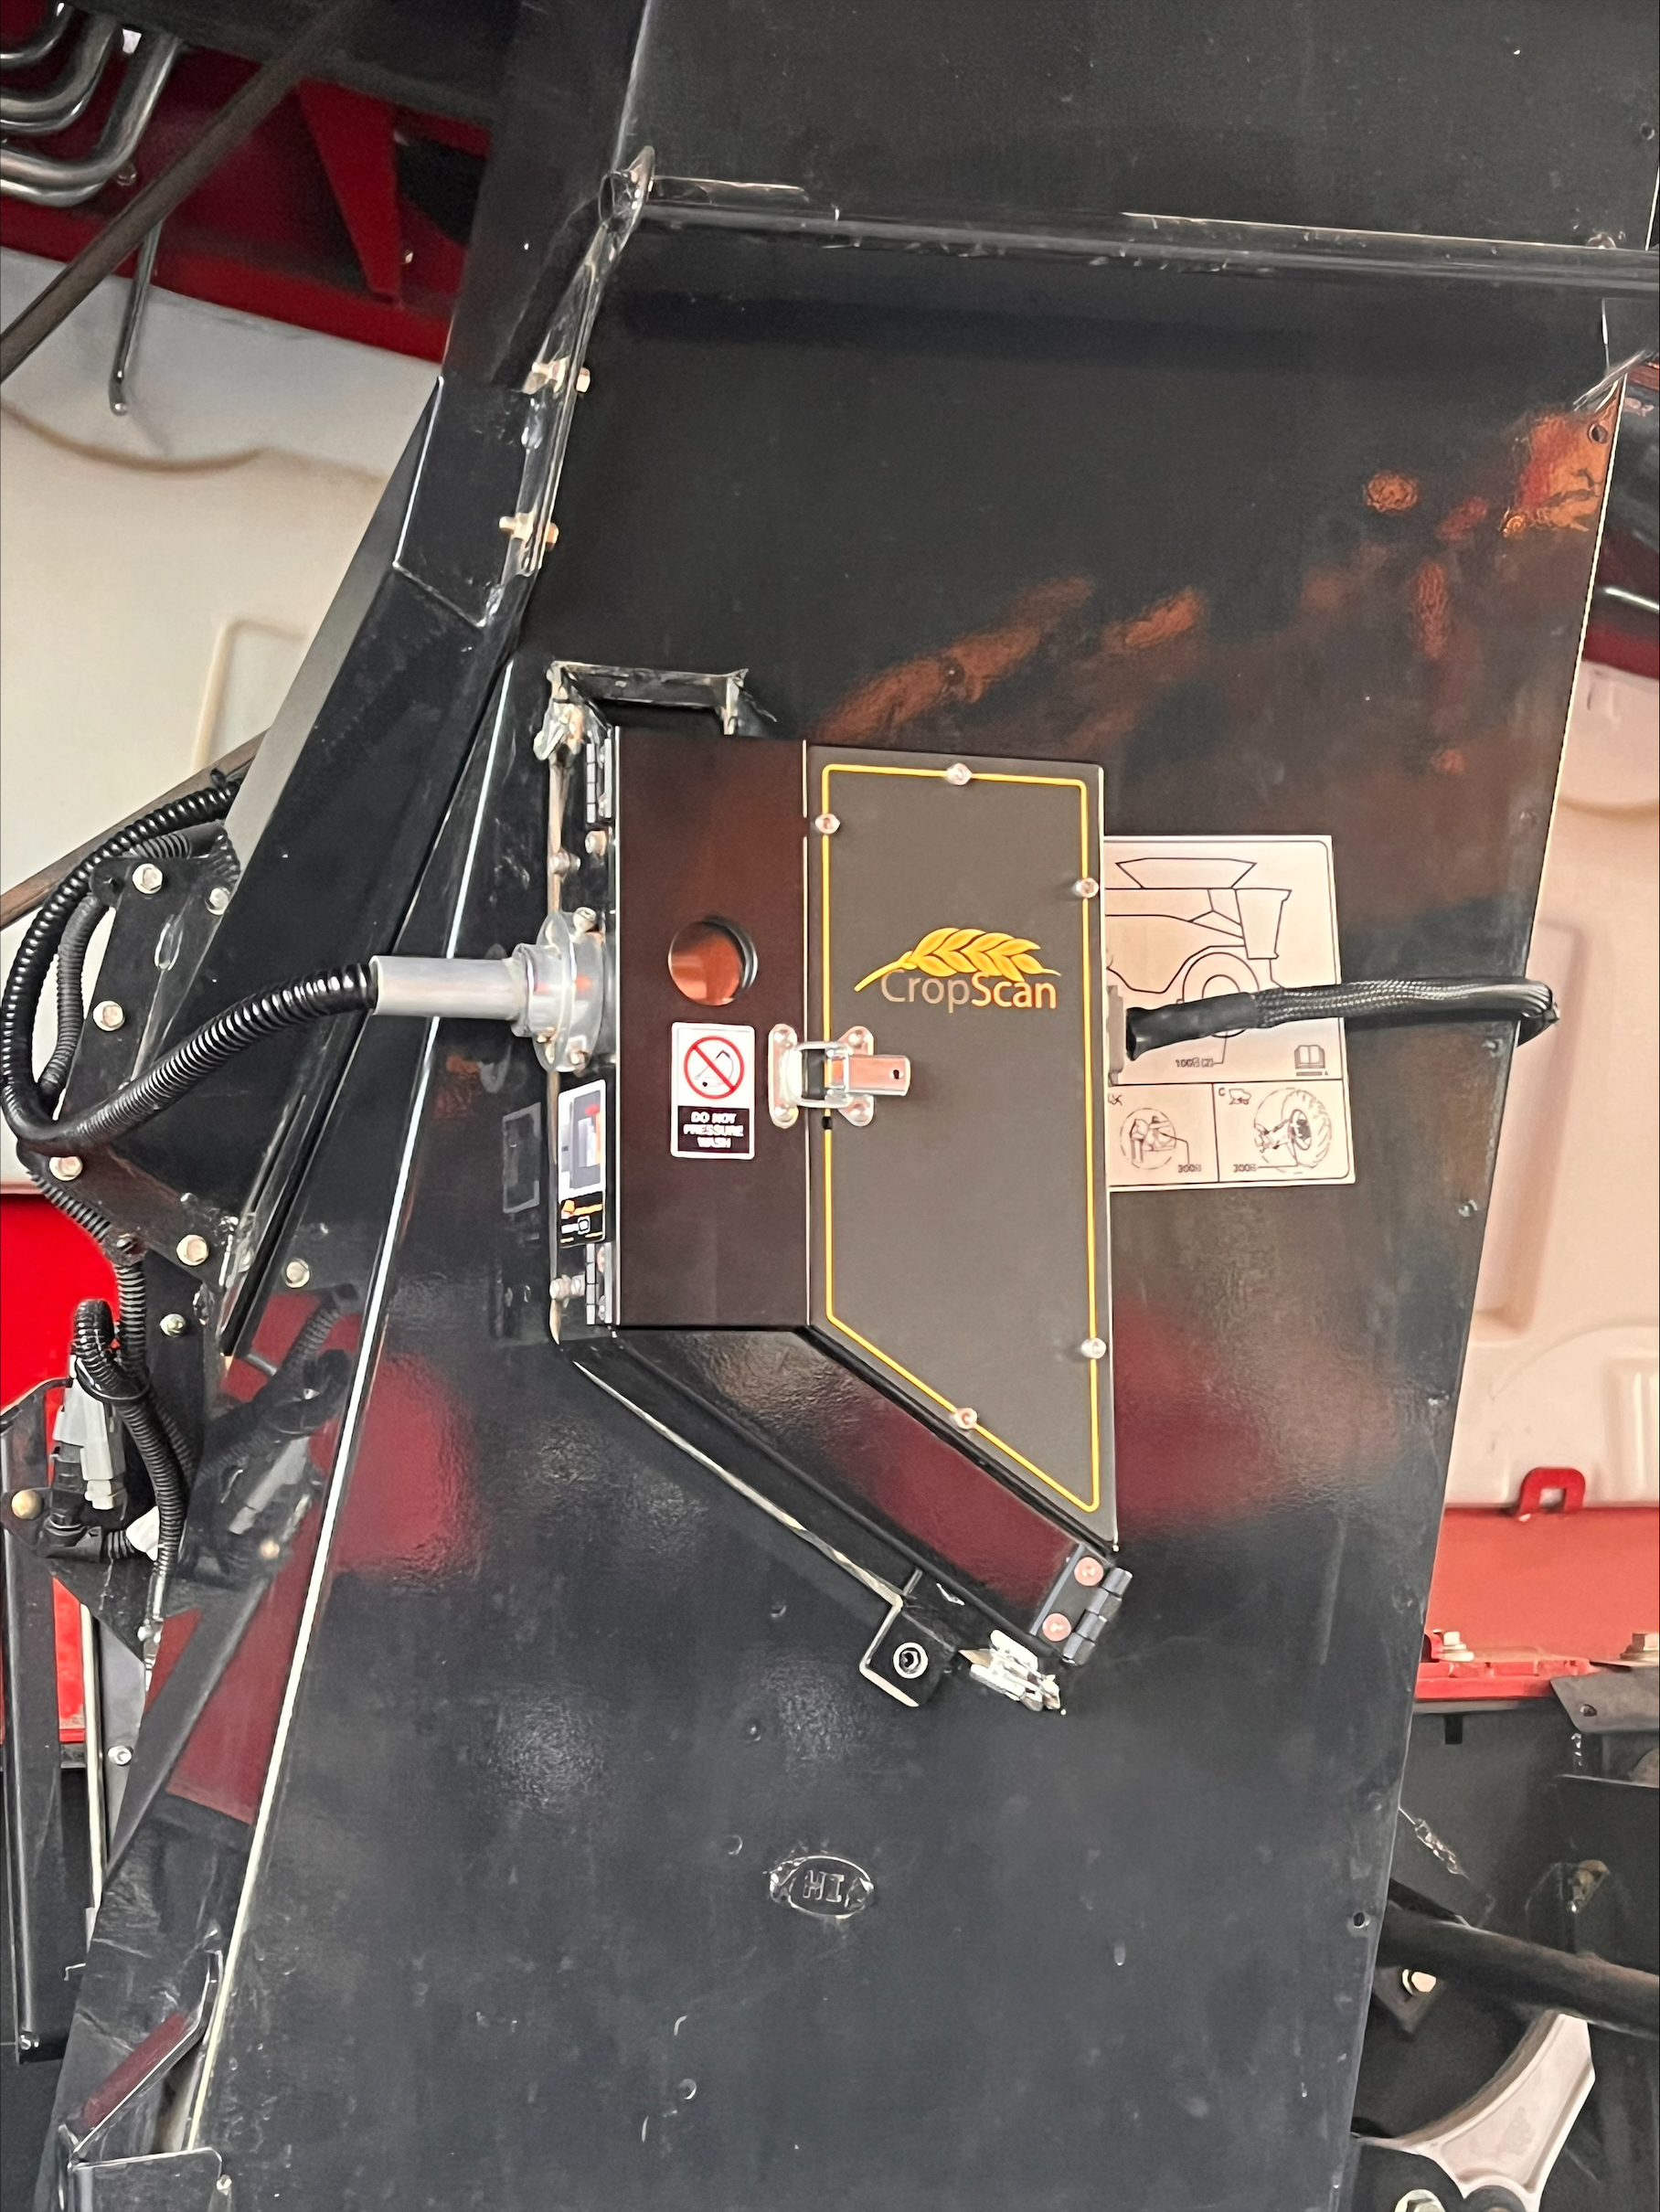
The CropScan 4000VT is fully integrated into the MY23/24 Case IH 50 Series and New Holland CR combines. The CropScan 4000VT is ISOBUS compatible and runs a Virtual Terminal on Pro 700/Pro 700 Plus, Pro 1200 and IntelliView IV and V monitors. The CropScan 4000VT measures Protein, Moisture, Oil and Starch in grains and oil seeds as they are harvested. By reading CANBUS messages from the combine, such as Crop Type, Grower-Farm-Field, Rotor Engage, Yield and Tank Weight, the CropScan 4000VT offers seamless integration between the CropScan and the combine.

Case Study
Validation of Canola Protein, Moisture and Oil Predictions Using CropScan 4000VT and Foss Nova Infratec Instruments

Canola Protein, Moisture and Oil Prediction and Validation Study CropScan 4000VT

Case-Study-31-Canola-Protein-Moisture-and-Oil-Prediction-and-Validation-Study-CropScan-4000VT

Improving Nitrogen Decisions with Harvest Protein Mapping

CropScan Protein Mapping allows growers to visualise nitrogen variability at harvest. When
combined with targeted Deep N testing, protein maps help identify nitrogen opportunity
zones, improve fertiliser allocation, reduce unnecessary applications and support the
development of more effective variable-rate nitrogen strategies.

Case-Study-44-Improving-Nitrogen-Decisions-with-Harvest-Protein-Mapping-Final.pdf

CROPSCAN 4000VT VALIDATION REPORT ON NEXT GEN COMBINES

The CropScan 4000VT has met or exceeded all validation benchmarks required for
deployment on CNH's latest CR11, AF9/10/11, and 8260 combines. Key achievements
included:
Rapid and repeatable hardware installation
Seamless CANbus and software integration
Lab-grade calibration accuracy
Highly effective internal thermal regulation
Consistent in-field performance across diverse environments

Case-Study-36-4000VT-Validation-on-Next-Gen-Combines-Rev-II.pdf

Maximize Your Fertilizer Efficiency

By using the CropScan On Combine Grain Analyser to measure Protein in the crop, the Clarkes
were able to optimize Nitrogen application and gain an additional $9,760 in profit from the 32
hectare low-protein zone. The above maps show the before and after effect on the Yield and
Protein. The data shows that both the Yield and the Protein were evened out, indicating the
variable rate fertilizer strategy was key to the remediation of the field.

Case-Study-33-Maximise-Your-Fertilizer-Efficency.pdf

Company