
Low yields from wheat production? Here’s why.
Jul 23 2025
For the past two decades, agronomists and farmers have been trying to solve the problem of low yields using Variable Rate Fertilisation application.
However, yield is only half of the equation. In-field protein measurements provide the other half of the equation, which AgTech now makes it much easier to achieve.
In this Farmer Advice article, Phil Clancy, CEO of Next Instruments, shares his insight into how AgTech can diagnose and improve plant performance.
Connect with Phil on LinkedIn.
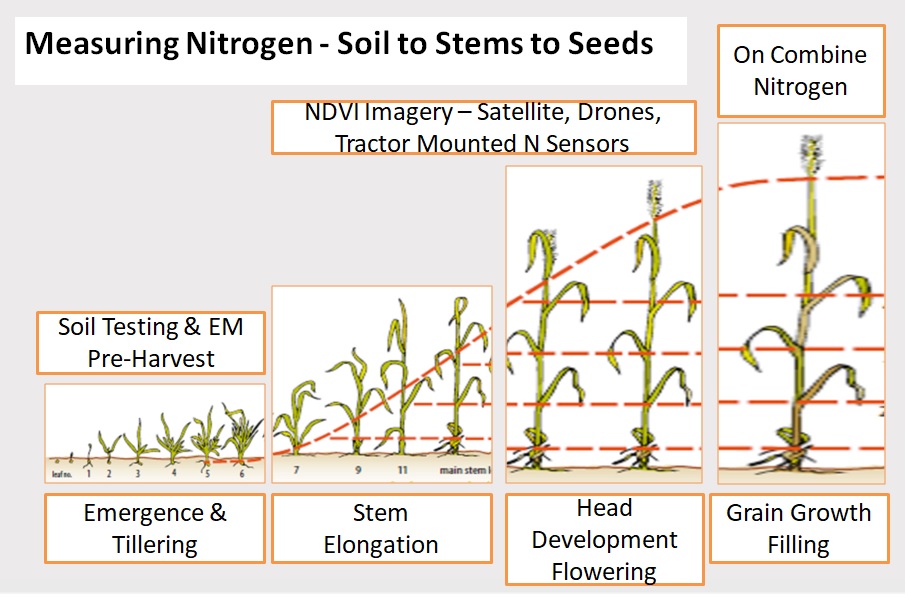
Nitrogen needs to be available at both the tillering and the reproductive stages to achieve optimum yield at the correct protein level. Proteins are made up of amino acids which contain 17.5% Nitrogen by weight. Measuring protein in seeds is directly related to Nitrogen uptake and availability from the soil.
NSW DPI research 1 has shown the optimum yield for wheat crops is achieved at protein levels of approximately 11.5 per cent. An on-combine NIR grain analyser can measure protein in grains and oil seeds in real-time as they are stripped in the field.
By combining yield and protein, a Nitrogen removal map can be generated that shows how much Nitrogen has been extracted from the soil in the form of protein.
A protein/Nitrogen/yield correlation map shows the availability and uptake of Nitrogen by the crop and explains if the full yield and protein potentials have been achieved.
There are four scenarios that we can look at to understand how protein and yield are related, and how Nitrogen impacts a plant’s performance.
Low Yield and Low Protein:
In this scenario, yield has been limited by insufficient Nitrogen in the soil at leaf emergence and then in the growth phase. Other nutrient deficiencies may also be impacting the yield.
High Yield and Low Protein:
There was sufficient Nitrogen available for the early growth stage in this scenario, but not enough during the grain growth and filling stages.
Low Yield and High Protein:
Here, we see there was insufficient Nitrogen available to support tiller development, however there was sufficient Nitrogen available in the reproductive and grain filling stages to achieve higher protein.
High Yield and High Protein:
In this scenario, there was sufficient Nitrogen available for development of tillers and through the entire plant development to achieve the optimum Yield and Protein, i.e., “Sweet Spot”.
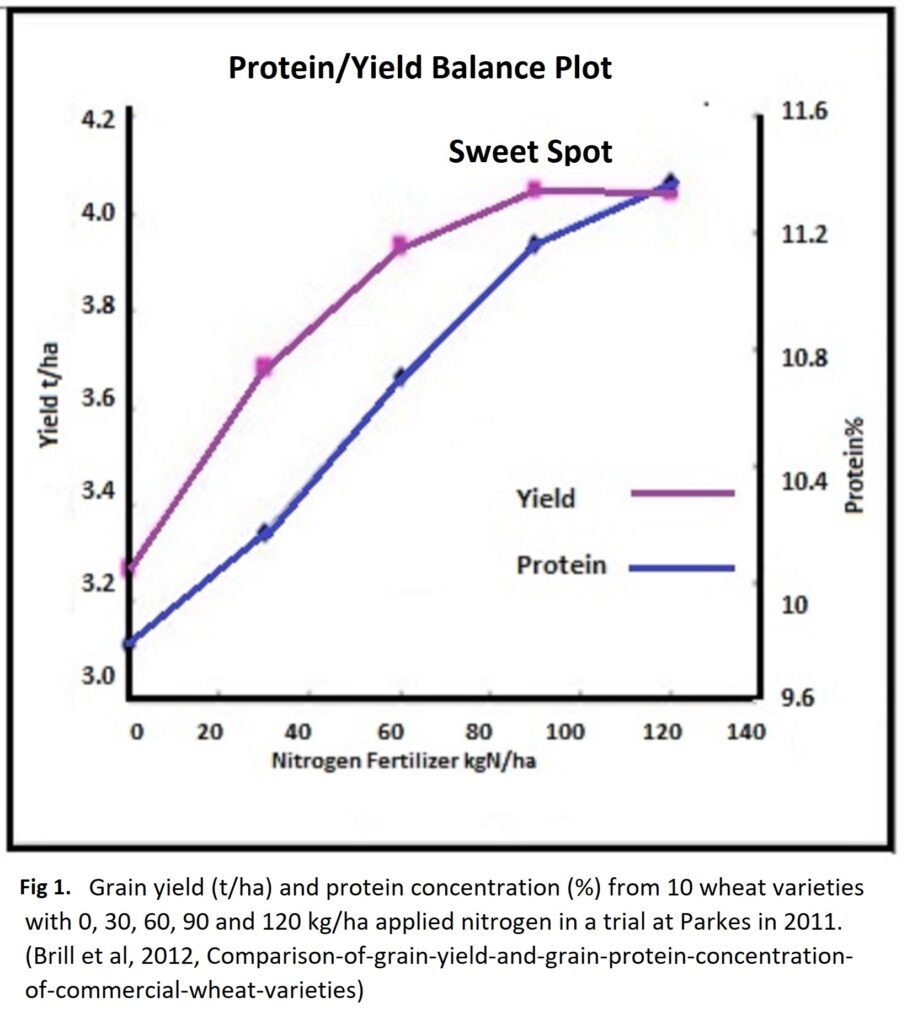
Achieving the ‘Sweet Spot’
At a protein level of approximately 11.5%, the yield should be approximately 4 tonne/ha if there is sufficient Nitrogen and moisture in the soil and no micronutrient deficiencies.
Once the plant reaches the growth stage, DC30, the head size has been determined and the plant has finished tillering, then the potential yield has been set, but not realised.
Nitrogen is required in all growth stages to ensure that the heads are fully developed. If there is insufficient Nitrogen in the soil during tiller production, head formation or flowering then the plant will adjust yield potential in line with the available Nitrogen.
If there is sufficient Nitrogen in the soil then the heads should fill completely, i.e. achieve their full yield potential, and reach their optimum protein levels.
With sufficient water, then Nitrogen is the major driver of yield. If you have sufficient water in the soil but not enough Nitrogen, then the yield will be limited.
Adding more Nitrogen to a field where there are low tiller numbers and therefore low head numbers, will not recover the yield potential. Excess Nitrogen will then be used by the plant to produce more protein.
For the past 20 years, agronomists and farmers have been trying to solve the problem of low Yields using Variable Rate Fertilization application. Yield is only half of the equation. Now in-field Protein measurements provide the other half of the equation, and the problem can now be solved.
By Phil Clancy
Next Instruments
Authors note: Growers can create scenarios using agtech solutions like the CropScanAg/CropScan 4000VT On Combine Grain Analyser, and CropScanAg N-GAUGE Nutrient Manager App, to collect, generate and analyse their data.
- Comparison of grain yield and grain protein concentration of commercial wheat varieties R Brill¹, M Gardner², N Fettell³ and G McMullen² ¹NSW DPI Coonamble � ²NSW DPI Tamworth � ³University of New England and NSW DPI, Condobolin ↩︎
Companies Mentioned
You Might Also Like
May 25 2025
Get more from your livestock data with these six agtech solutions
Farmers across Australia are producing more data than ever. But much of it remains frustratingly siloed. Here’s how you can get the most from your data as a livestock producer.
Read MoreMay 20 2025
Purchasing AgTech? Ask yourself these five questions first.
Whether it’s your first time, or you’ve already got plenty of technology in operation – asking the right questions ensures you take the best approach.
Read MoreApr 22 2025
Building farm data trust
At AgTech Finder we ask vendors to provide their data policies so that farmers can make informed choices about agtech and be comfortable about the way their data is being collected and…
Read MoreDec 13 2024
Buying AgTech Online
AgTech equipment, sensors, monitoring gear and all the accessories can be a bit of an investment, and every piece is an important piece of a much larger puzzle. If you’re buying agtech…
Read MoreGet listed on AgTech Finder.
AgTech Finder helps Australian farmers and producers find the product that’s right for them.
Register now to be a part of the community, get access to a national platform and start gaining insights to improve your products.